DATA
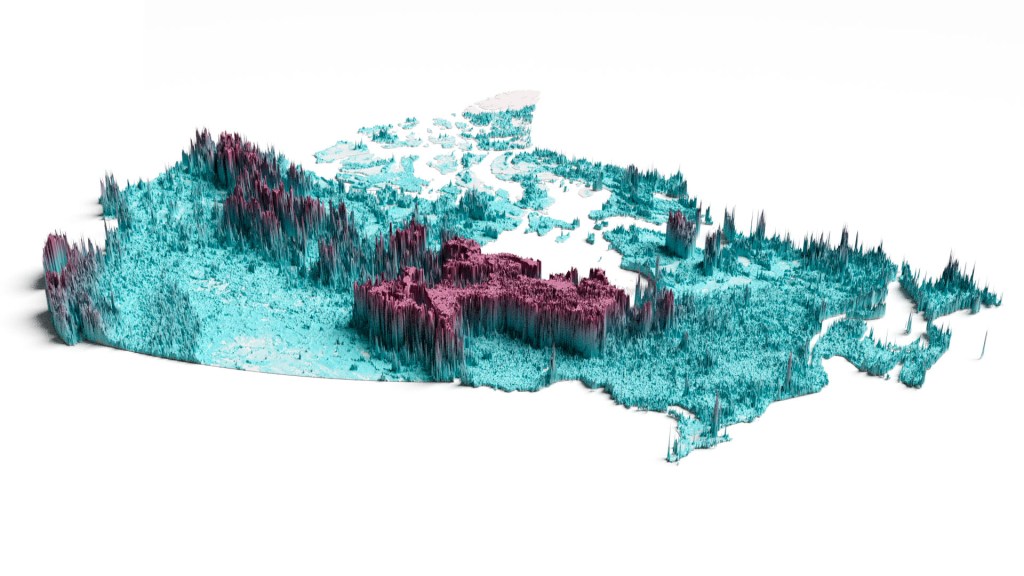
1. Soil and biomass carbon stocks of Canada
Download here Forest carbon stock and uncertainty maps of Canada (kg/m², Years= 2015-2019) and Soil carbon stock and uncertainty maps of Canada (kg/m² -0-30cm and 0-1m soil depth). Reference “Sothe, C., Gonsamo, A., Arabian, J., Kurz, W. A., Finkelstein, S. A., & Snider, J. (2022). Large soil carbon storage in terrestrial ecosystems of Canada. Global Biogeochemical Cycles, 36(2), e2021GB007213.” Download here soil carbon concentration (g/kg) in Canada at 6 soil depths: 0cm, 5cm, 15cm, 30cm, 60cm and 100cm. Reference Sothe, C., Gonsamo, A., Arabian, J., & Snider, J. (2022). Large scale mapping of soil organic carbon concentration with 3D machine learning and satellite observations. Geoderma, 405, 115402.

2. Circumpolar vegetation dynamics (CVD) product
Phenology index (PI) based vegetation dynamics product, comprising start (SOS), end (EOS), length of growing season (LOS), and growing season integrated annual normalized difference vegetation index (NDVI), specifically designed for the entire circumpolar north (> 45oN) using SPOT VGT data starting from 1999.
“Gonsamo A. & J.M. Chen (2015). Circumpolar vegetation dynamics product for global change study. Remote Sensing of Environment, 182, 13–26.” Download the CVD product
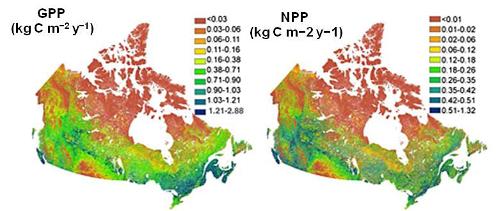
3. 250m gross and net primary productivity of Canada’s landmass
Canada’s gross primary productivity (GPP) and net primary productivity (NPP) simulated using boreal ecosystem productivity simulator (BEPS) at 250 m spatial resolution with improved input parameter and driver fields and phenology and nutrient release parameterization schemes. The daily GPP and NPP are simulated over Canada at 250 m spatial resolution, the highest resolution simulation yet for the country or any other comparable region. Total NPP (GPP) for Canada’s land area was 1.27 (2.68) Pg C for 2008, with forests contributing 1.02 (2.2) Pg C.
“Gonsamo, A., J.M. Chen, D.T. Price, W.A. Kurz, J. Liu, C. Boisvenue, R.A. Hember, C. Wu, K.-h. Chang (2013). Improved assessment of gross and net primary productivity of Canada’s landmass. Journal of Geophysical Research Biogeosciences, 118, 1546–1560.” Download link
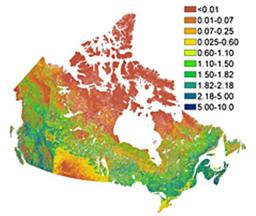
4. Every 10-day 250m leaf area index of Canada’s landmass
The University of Toronto (UofT) LAI system was improved (v2) including enhanced spatial resolution (250 m) by considering an improved land cover map, local topography, clumping index, and background reflectance variations in order to produce canopy LAI time series. The 10-day data for entire Canada and the ENVI header files can be downloaded here (see below). “Gonsamo, A., J.M. Chen (2014). Improved LAI algorithm implementation to MODIS data by incorporating background, topography, and foliage clumping information. IEEE Transactions on Geoscience and Remote Sensing, 52, pp. 1076–1088.”
Download link
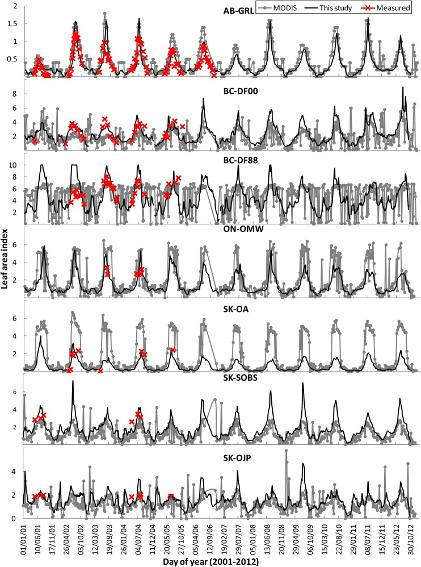
5. Continuous observation of leaf area index at Fluxnet-Canada sites
Continuous observation of leaf area index (LAI) is needed in order to interpret and model carbon, water and energy fluxes measured at Fluxnet tower sites. Although remote sensing LAI products can be used in regional and global scale modelling with reasonable performance, the site level modelling of ecophysiological processes needs more accurate LAI time series than those provided by global LAI products. Here we apply a semi-empirical approach using satellite measured modified soil-adjusted vegetation index (MSAVI) and sparsely sampled LAI time series measurements at 7 Canadian Carbon Program (CCP) flux tower sites to produce continuous observations of site level LAI. The LAI time series is for 2000-present. “Gonsamo A, Chen JM (2014). Continuous observation of leaf area index at Fluxnet-Canada sites. Agricultural and Forest Meteorology 189: 168-174.”
Download link

6. Spectral Response Cross Calibration Equations for 21 Satellite Sensors
Global and regional vegetation assessment strategies often rely on the combined use of multisensor satellite data. Variations in spectral response function (SRF) which characterizes the sensitivity of each spectral band have been recognized as one of the most important sources of uncertainty for the use of multisensor data. Here, we provide the SRF cross calibration equations for 21 Earth observation satellite sensors and their cross-sensor corrections for red, near infrared (NIR), and shortwave infrared (SWIR) reflectances, and normalized difference vegetation index (NDVI) aimed at global vegetation monitoring. The training data set to derive the SRF cross-sensor correction coefficients were generated from the state-of-the-art radiative transfer models. Our approach includes a polynomial regression and spectral curve information generated from a training data set representing a wide dynamics of vegetation distributions to minimize land cover specific SRF cross-sensor correction coefficient variations. Variations in processing strategies, non spectral differences, and algorithm preferences among sensor systems and data streams hinder cross-sensor spectra and NDVI comparability and continuity. The SRF cross-sensor correction approach provided here, however, can be used for studies aiming at large-scale vegetation monitoring with acceptable accuracy. “Gonsamo A., and J.M. Chen (2013). Spectral response function comparability among 21 satellite sensors for vegetation monitoring. IEEE Transactions on Geoscience and Remote Sensing, 51, 1319-1335.”
Download link
CIMES-FISHEYE PACKAGE OF SOFTWARE PROGRAMS
Copyright (C) “1982-2014 by Jean-Michel Walter”
Contributor: Alemu Gonsamo
CIMES is distributed under the terms of the GNU General Public License.
Citation: Gonsamo A, Walter J-M and Pellikka P (2011) CIMES: A package of programs for determining canopy geometry and solar radiation regimes through hemispherical photographs. Computers and Electronics in Agriculture 79, 207-215.
CIMES-FISHEYE IS ALSO HOSTED HERE
Source codes will be provided upon request (see below for email addresses)
CIMES features
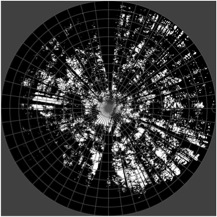
CIMES-FISHEYE is a package of free programs for the analysis of hemispherical photographs (HP) of forest canopies, to extract key canopy attributes like solar radiation indices, leaf area index, canopy openness, etc. These programs offer a unique set of features for film and digital hemispherical photography:
- Ability to process both grey-toned and classified images
- A variety of algorithms to invert gap fraction data
- Values for sky segments and overall values
- Works on any range of zenith and azimuth view angles
- Single photosites or whole plots (transects, grids, etc.)
- Correction for slope (LAI and solar radiation)
- Tools to account for foliage clumping
- Spherical statistics for gap fraction distribution
- PAR interception, sun-fleck dynamics.
Programs are written in C and C++ languages, ensuring portability over any computing system: Windows (32 and 64 bits), Mac OS X (Intel-based, Power PC G4 and G5), LINUX and UNIX. CIMES-FISHEYE is not a self-contained software based on a graphical user interface (GUI). Before running the programs, graphical pre-processing is needed, using commercial or free graphical software.
CIMES-FISHEYE consists of command-line programs, which run independently of each other, like a toolbox.
CIMES-FISHEYE programs stemmed from an early UNIX environment (1982) and were progressively adapted to other environments (Windows, Mac OS X, LINUX), regularly improved and updated (2018).
A companion manual introduces to hemispherical photography of forest canopies, from film or digital cameras, providing theoretical background and a practical user’s guide. Numerous references accompany the manual.
CIMES contents
The package contains the following archives and files (click on archive or file name for download):
- CIMESOSX.zip Binaries for Mac OS X® (Universal PPC G4, G5 and Intel® based)
- CIMESWIN.zip Binaries for PC (Windows®)
- CIMESLNX.zip Binaries for PC (LINUX®)
- MANUALGENRL.zip Manual files: Outline, Theory, Practice, References
- MANUALSOLAR.zip Manual files: Solar Radiation Regimes
- MANUALSTRUC.zip Manual files: Canopy Structure
- Updates Updates, history
- Readme Detailed features and installation guide
Binaries contain the following files:
- MAIN: GFA
- SOLAR RADIATION : PARCLR, PARHOR, PARSOC, SUNFLK, SUNEPHEMERIS
- CANOPY STRUCTURE: READPHOT, OPENNESS, STATSPH, LAISTS, LAINRC, LAIMIL, LAILANG, LANG, LAIMLR, TRANSLAI, LAICMP, LAICAM, LOGCAM, PCS
These command-line programs are stand-alone. They can be extracted from the archives. GFA is the core program. It extracts gap fraction and gap size data from digital (or digitized) images in BMP format. All other programs use gap fraction data and/or gap size data created by GFA. Batch processing of any number of HP is easy under Windows, Mac OSX, and UNIX as well.
The manual, user’s guide and programs documentation, is composed of three parts: (i) General, (ii) Sun files, (iii) Structure files. <readmeHP.pdf> explains how to install and use the programs.
Disclaimer CIMES-FISHEYE © is a free package of programs distributed without any warranty. If used for publication, please refer to Citation, as indicated above.
CIMES Contacts
- Jean-Michel Walter – Université de Strasbourg, Faculté des Sciences de la Vie, Institut de Botanique – 28, Rue Goethe 67083 Strasbourg Cedex, France jmnw@free.fr or
- Alemu Gonsamo – School of Earth, Environment & Society, McMaster University, 1280 Main Street West, Hamilton, Ontario, Canada
L8S 4K1 Email: gonsamoa@mcmaster.ca
